Reference: U.S. Census Releases 2018 Voting and Registration Data, New Data Show Voter Turnout From Midterm Elections
UPDATED POST: Interactive Map: 2018 Voter Turnout by State (via Stateline)
UPDATED POST: Behind the 2018 U.S. Midterm Election Turnout (Highlights and Data Visualizations)
From the United States Census:
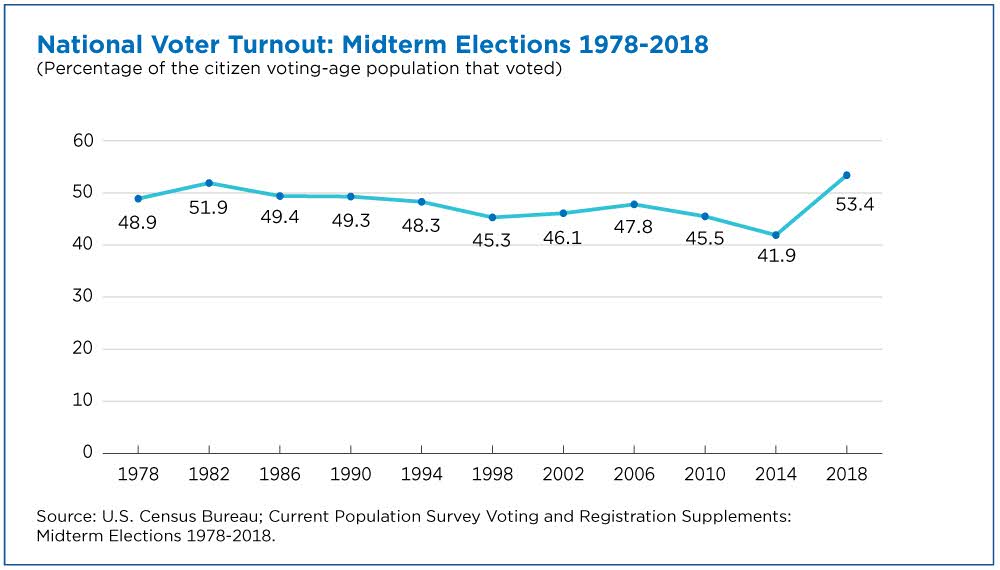
Today the U.S. Census Bureau released the 2018 voting and registration table package. These November 2018 election data come from the Voting and Registration Supplement to the Current Population Survey, which surveys the civilian noninstitutionalized population in the United States.
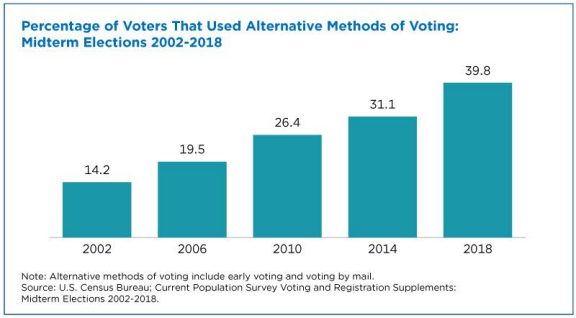
This table package [14 tables, .xls] provides data down to the state level on voter turnout and shows the use of alternative voting methods. These tables also present a portrait of the voting population by demographic and economic variables including race, sex, age, educational attainment, employment status, tenure, income, disability, marital status, citizenship and veteran status.
The Census Bureau has fielded the Voting and Registration Supplement to the Current Population Survey every two years since 1964. For data from previous election years, visit the Voting and Registration page.
Direct to Data: Voting and Registration in the Election of November 2018
See Also: Voter Turnout Rates Among All Voting Age and Major Racial and Ethnic Groups Were Higher Than in 2014
Filed under: Data Files, News
About Gary Price
Gary Price (gprice@gmail.com) is a librarian, writer, consultant, and frequent conference speaker based in the Washington D.C. metro area. He earned his MLIS degree from Wayne State University in Detroit. Price has won several awards including the SLA Innovations in Technology Award and Alumnus of the Year from the Wayne St. University Library and Information Science Program. From 2006-2009 he was Director of Online Information Services at Ask.com.


